Quarkus observability as a practical reference
At some point, every project claims “we have monitoring” and what it really means is:
- one dashboard nobody trusts,
- logs without context,
- traces that exist only in slides.
So I built a proper reference implementation in quarkus-observability.
The goal was simple: have one repo I can copy from for future projects, and finally understand the full path from request to trace to logs to metrics without hand-wavy gaps.
What happened over that session
The commit timeline is basically the diary:
2026-02-14 13:43 | Initial commit
2026-02-14 14:00 | initial CoffeeShop setup
2026-02-14 15:40-16:20 | multiple amend/rebase/reset iterations
2026-02-14 17:29 | dashboard and UX polish pass
Based on the reflog, the visible implementation sprint happened on Saturday, February 14, 2026, from early afternoon into early evening, with several rewrite passes in between. I still would not pin this to an exact duration, because the thinking and reading part was the bigger chunk anyway. It ended somewhere between “just one more panel” and “why are there 12 tabs open in Grafana?“.
What I actually built
The stack is local-first with Docker Compose and includes:
- Quarkus app (
app) - OTel Collector with tail sampling
- Tempo for traces
- Prometheus for metrics
- Loki + Promtail for logs
- Grafana as central UI
- Redpanda/Kafka + MariaDB for the business flow (CoffeeShop order lifecycle)
The hardest part was not writing the YAML or Java code. It was reading the documentation of each component carefully enough to wire everything together correctly: Quarkus, OTel Collector, Tempo, Prometheus, Loki, Promtail and Grafana all have slightly different expectations.
The part that made it click for me
The real win was making correlation explicit instead of accidental:
- Requests create spans in Quarkus.
- Spans go via OTLP HTTP to the collector.
- Collector keeps important traces (errors, slow requests, business endpoints) and down-samples the rest.
- Logs include
trace_idandspan_id. - In Grafana, I can jump from trace to logs and back without guessing.
That sampling setup looked roughly like this:
- keep-errors
- keep-slow-traces (>= 1000ms)
- keep-business-order-lifecycle (/coffeeshop/orders...)
- sample-technical-q-endpoints (5%)
- sample-fast-normal-traces (10%)
And this log format turned out to be non-negotiable:
quarkus.log.console.format=... trace_id=%X{traceId} span_id=%X{spanId} ...Without those fields, “observability” quickly becomes archaeology.
Why this became my reference repo
I wanted something practical I can copy into future services, not another “hello telemetry” demo. So this repo now includes:
- outbox-based event publishing (DB + Kafka flow)
- runbook-style docs and config reference
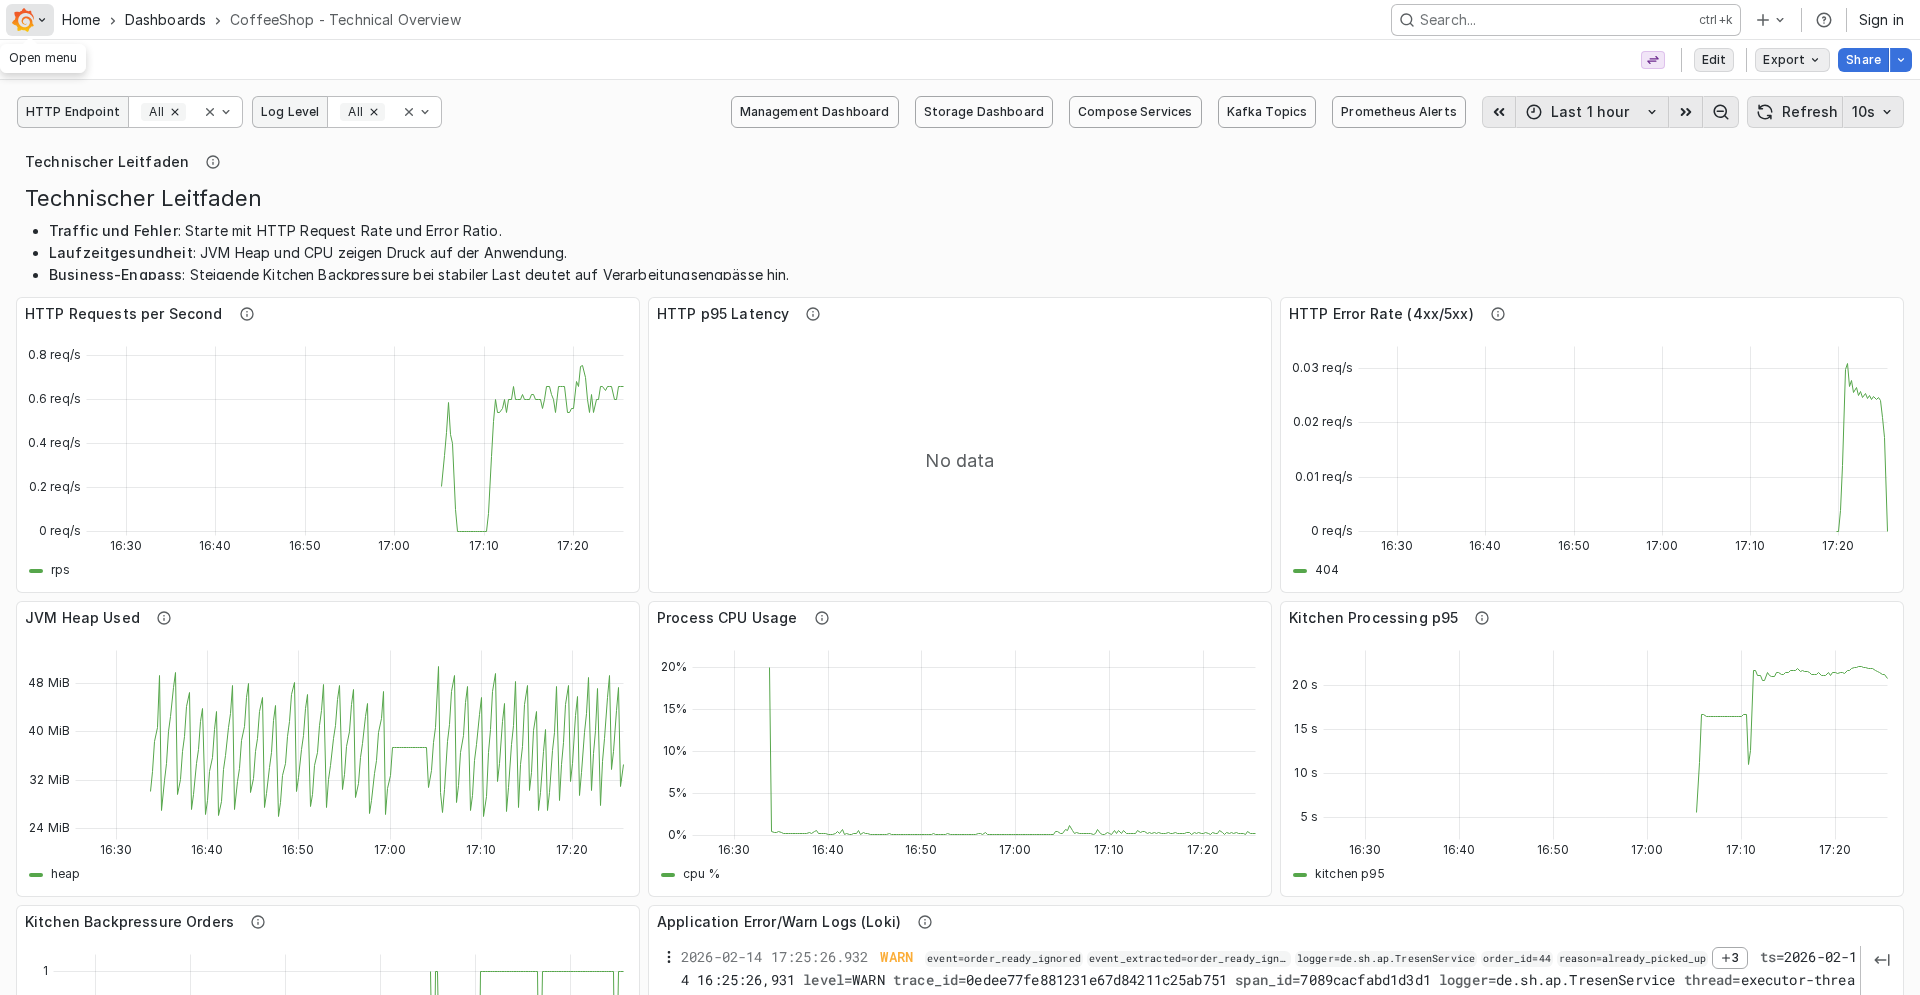
- working dashboards for technical and management views
- a small load script (
./scripts/load-coffeeshop.sh) to generate realistic traces quickly
The load script was especially useful because it repeatedly creates and picks up orders, which made it easy to validate end-to-end behavior under repeated flows.
One screenshot that sums it up
This is the point where it felt “real”: opening a trace in Grafana and correlating it with logs.
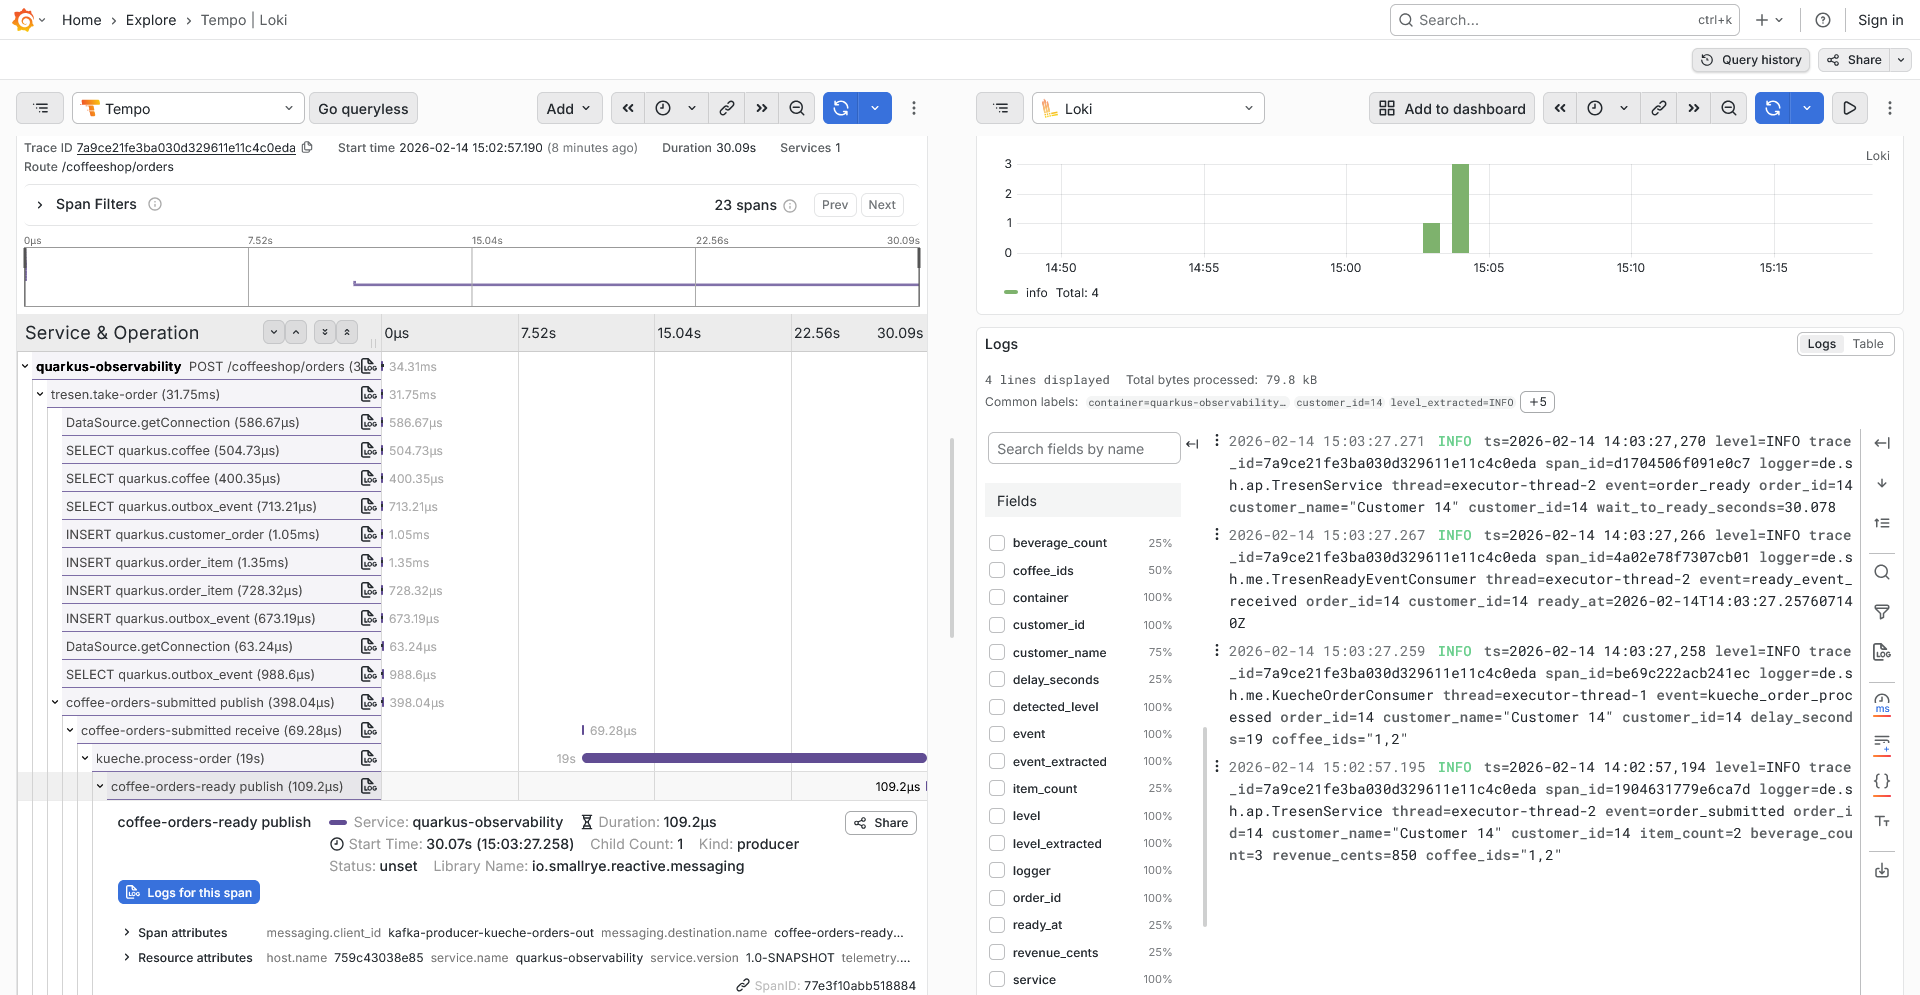
If it’s not observable end-to-end, it doesn’t exist yet.
What I would copy first into other projects
If I had to pick only three things:
- trace/log correlation (
trace_id,span_idin logs) - head + tail sampling strategy (not only one side)
- a runnable local stack that new teammates can start with one command
Everything else is optimization.
And yes, this started as “just a quick setup”.